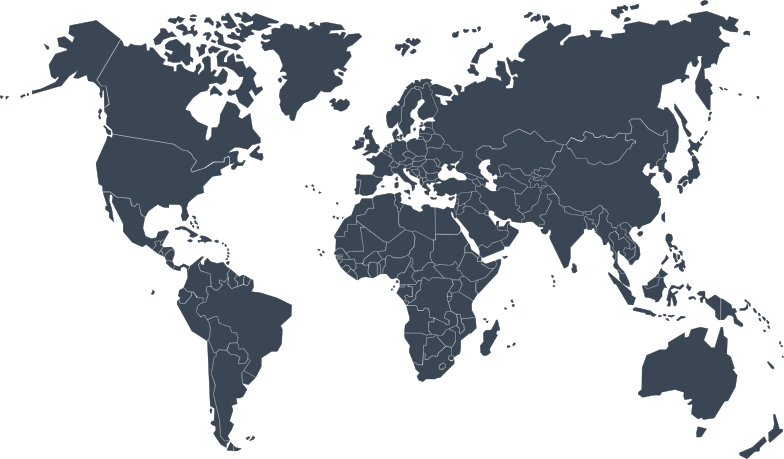
[{"id":"jfk-lhr","from":"JFK","to":"LHR","fromName":"New York","toName":"London","pax":"1,240","load":87,"flights":"14/wk","aircraft":"A350-900","fare":"$486","otp":91,"note":"Flagship transatlantic bank. Premium cabin is holding; Heathrow slot pressure builds into summer.","x1":252,"y1":362,"x2":404,"y2":370},{"id":"lax-nrt","from":"LAX","to":"NRT","fromName":"Los Angeles","toName":"Tokyo","pax":"980","load":91,"flights":"10/wk","aircraft":"777-300ER","fare":"$612","otp":88,"note":"Load is tight enough to look at an upgauge before the holiday bank. Narita evening wave is the pinch.","x1":150,"y1":388,"x2":715,"y2":415},{"id":"dxb-sin","from":"DXB","to":"SIN","fromName":"Dubai","toName":"Singapore","pax":"1,105","load":84,"flights":"12/wk","aircraft":"A380-800","fare":"$428","otp":94,"note":"Sixth-freedom traffic is healthy. Connecting bags to BKK and CGK are the delay risk, not the sector itself.","x1":532,"y1":470,"x2":658.5,"y2":528},{"id":"cdg-jfk","from":"CDG","to":"JFK","fromName":"Paris","toName":"New York","pax":"890","load":79,"flights":"11/wk","aircraft":"A330-900","fare":"$454","otp":86,"note":"Softest of the Atlantic set. Corporate accounts are slower to rebook; weekend leisure is carrying the week.","x1":415,"y1":390,"x2":252,"y2":362},{"id":"gru-mad","from":"GRU","to":"MAD","fromName":"São Paulo","toName":"Madrid","pax":"720","load":82,"flights":"7/wk","aircraft":"A330-200","fare":"$398","otp":84,"note":"Brazil market is a little soft overall, but this corridor is still covering. Watch currency and GRU bank timing.","x1":310,"y1":600,"x2":400,"y2":420},{"id":"syd-sin","from":"SYD","to":"SIN","fromName":"Sydney","toName":"Singapore","pax":"650","load":88,"flights":"9/wk","aircraft":"A350-900","fare":"$441","otp":90,"note":"Reliable connector into the SIN hub. High load with a friendly fare mix — keep the frequency.","x1":745,"y1":640,"x2":658.5,"y2":528},{"id":"sfo-icn","from":"SFO","to":"ICN","fromName":"San Francisco","toName":"Seoul","pax":"740","load":85,"flights":"6/wk","aircraft":"787-9","fare":"$538","otp":89,"note":"In negotiate for a second daily. Tech traffic plus VFR is a nice mix if Incheon slots land.","x1":154,"y1":370,"x2":693,"y2":411},{"id":"ord-fra","from":"ORD","to":"FRA","fromName":"Chicago","toName":"Frankfurt","pax":"810","load":83,"flights":"8/wk","aircraft":"787-10","fare":"$472","otp":87,"note":"Cargo belly is doing extra work here. Passenger load is fine; freight is the reason to protect the metal.","x1":215,"y1":358,"x2":428,"y2":382},{"id":"mia-bog","from":"MIA","to":"BOG","fromName":"Miami","toName":"Bogotá","pax":"560","load":80,"flights":"12/wk","aircraft":"737-8","fare":"$268","otp":82,"note":"Demand is building ahead of the seasonal leisure peak.","x1":210,"y1":455,"x2":236,"y2":505},{"id":"ams-jfk","from":"AMS","to":"JFK","fromName":"Amsterdam","toName":"New York","pax":"705","load":81,"flights":"7/wk","aircraft":"777-200ER","fare":"$449","otp":92,"note":"On-time star of the Atlantic. Yield is a touch light versus CDG, but reliability is selling the route.","x1":420,"y1":368,"x2":252,"y2":362},{"id":"doh-sin","from":"DOH","to":"SIN","fromName":"Doha","toName":"Singapore","pax":"930","load":86,"flights":"10/wk","aircraft":"A350-1000","fare":"$415","otp":95,"note":"Hub-to-hub smoothness. Almost no irregular ops this month — a good contrast with the DXB wave.","x1":526,"y1":465,"x2":658.5,"y2":528},{"id":"yyz-lhr","from":"YYZ","to":"LHR","fromName":"Toronto","toName":"London","pax":"860","load":84,"flights":"9/wk","aircraft":"A330-300","fare":"$421","otp":88,"note":"Steady Canadian corporate plus visiting-friends traffic. Not flashy, covers well every week.","x1":230,"y1":355,"x2":404,"y2":370}]
{"den-cun":{"title":"DEN → CUN","kicker":"Discover · Leisure expansion","meta":"$0.7M · 28% confidence · $198 estimated rate","owner":"Network planning","due":"This week","why":"Search volume for Cancún is ahead of last winter, but the fare file is still priced like a shoulder week.","actions":["Compare this year’s DEN–CUN search curve with last winter’s sold fares.","See if a 737-8 can hold through the leisure peak without bumping a Denver bank.","Send revenue management a go/no-go note by Friday."]},"bos-dub":{"title":"BOS → DUB","kicker":"Discover · Additional frequency","meta":"$0.5M · 22% confidence · $244 estimated rate","owner":"Slot desk","due":"This week","why":"Boston–Dublin is missing a midweek departure that corporate accounts keep asking for. The constraint is Dublin, not aircraft.","actions":["Ask the Dublin station which morning arrivals can still take a third weekly.","Check whether the Boston 07:40 bank has a spare narrowbody.","If no slot, park this until the next IATA season instead of forcing a red-eye."]},"atl-lis":{"title":"ATL → LIS","kicker":"Discover · Shoulder-season launch","meta":"$0.6M · 31% confidence · $276 estimated rate","owner":"Crew planning","due":"Next week","why":"Lisbon looks fine on paper, but the Atlanta pairing currently leaves a crew overnight that we do not need.","actions":["Rebuild the ATL–LIS pairing without the extra Lisbon layover.","Confirm hotel and per-diem cost against a same-day turn.","Only then take the frequency to the schedule committee."]},"mia-bog":{"title":"MIA → BOG","kicker":"Discover · Seasonal launch","meta":"$1.1M · 41% confidence · $268 estimated rate","owner":"Latin America","due":"This week","why":"Miami–Bogotá leisure is building into the dry season. We still need to prove it is not just one-way visiting-friends traffic.","actions":["Split last month’s bookings into leisure, visiting-friends, and corporate.","Check Bogotá evening arrival delays against a 737-8 turn.","If both directions cover, hold metal for a December start."]},"yyz-cun":{"title":"YYZ → CUN","kicker":"Discover · Leisure expansion","meta":"$0.8M · 38% confidence · $186 estimated rate","owner":"Leisure sales","due":"This week","why":"Toronto–Cancún is filling charters. A scheduled frequency only wins if we can beat those rates without dumping premium seats.","actions":["Line up charter net rates against a scheduled 737-8 with a real fare mix.","Ask leisure sales which tour operators would move if we published a twice-weekly.","Keep it in Discover until that mix covers."]},"dfw-gdl":{"title":"DFW → GDL","kicker":"Discover · Nearshore expansion","meta":"$0.9M · 44% confidence · $214 estimated rate","owner":"Corporate accounts","due":"This week","why":"Dallas–Guadalajara is being pulled by nearshore manufacturing, not weekend leisure. The cabin mix has to match that.","actions":["Pull the top 20 corporate accounts flying DFW–GDL on other airlines.","See whether a weekday-heavy pattern beats a weekend leisure pattern.","If business is over 40% of the cabin, move this to Propose."]},"ord-fra":{"title":"ORD → FRA","kicker":"Propose · Widebody upgauge","meta":"$2.4M · 58% confidence · $385 estimated rate","owner":"Fleet planning","due":"Today","why":"Chicago–Frankfurt is covering, and the belly cargo is doing extra work. The 787-10 is the next honest step, not another frequency.","actions":["Confirm a 787-10 is free in the Chicago bank without breaking Tokyo.","Price the upgauge against keeping the 787-9 and adding a Saturday.","Take the fleet note to the Wednesday network meeting."]},"sea-ams":{"title":"SEA → AMS","kicker":"Propose · Codeshare expansion","meta":"$1.9M · 55% confidence · $356 estimated rate","owner":"Alliances","due":"This week","why":"Seattle–Amsterdam only works if the partner gives us inventory we can actually sell, not leftover connecting seats.","actions":["Read the draft codeshare for Seattle origin inventory, not just Amsterdam connections.","Check the prorate against our own SEA–LHR fares.","Do not sign if we cannot control at least 40% of the cabin."]},"lax-cdg":{"title":"LAX → CDG","kicker":"Propose · Daytime frequency","meta":"$1.6M · 49% confidence · $401 estimated rate","owner":"Crew planning","due":"This week","why":"A daytime LAX–CDG would sell to corporate, but the current bid would force a crew to sit in Paris for 22 hours.","actions":["Rebuild the bid with a same-day Paris turn or a one-night cap.","Cost that layover against the extra daytime fare premium.","If the layover eats the premium, keep the overnight and drop this frequency."]},"sfo-icn":{"title":"SFO → ICN","kicker":"Negotiate · Additional frequency","meta":"$3.8M · 72% confidence · $412 estimated rate","owner":"Pacific slots","due":"Today","why":"A second daily San Francisco–Seoul is the most valuable open item this month. Incheon timing is the only thing left.","actions":["Confirm the Incheon evening arrival with the slot coordinator today.","Hold the 787-9 that is currently spare after the Narita bank.","If the slot slips past 21:00 local, pause — missed connections kill the case."]},"ewr-lhr":{"title":"EWR → LHR","kicker":"Negotiate · Premium upgauge","meta":"$2.9M · 68% confidence · $478 estimated rate","owner":"Atlantic slots","due":"Today","why":"Newark–Heathrow premium is sold out on the morning bank. A heavier business cabin only works if Heathrow does not push us into the afternoon.","actions":["Ask Heathrow for a 06:30–07:30 arrival, not a 10:00 dump into Terminal 3.","Confirm the two-class 777 can take the extra business seats without losing cargo.","Walk the slot time to the customer accounts that asked for the upgauge."]},"jfk-mad":{"title":"JFK → MAD","kicker":"Negotiate · Business-class rebuild","meta":"$2.1M · 61% confidence · $394 estimated rate","owner":"Corporate accounts","due":"This week","why":"JFK–Madrid business is thin unless the Barclays block actually books. Do not rebuild the cabin on hope.","actions":["Get a written seat block from Barclays for the next two quarters.","If the block is under 12 seats a flight, keep the current cabin.","Only then send the interior change to the fleet shop."]},"lax-nrt":{"title":"LAX → NRT","kicker":"Watch next · Load at 91%","meta":"777-300ER · 10/wk · $612 average fare","why":"Los Angeles–Tokyo is tight enough that we are leaving people behind into the holiday bank. The pinch is the Narita evening wave, not the aircraft type in general.","actions":["See if a 777-300ER can swap onto the 17:50 LAX departure for four weeks.","Check Narita ground time — an upgauge that misses the evening wave is wasted.","If the swap holds, publish the extra seats before the Thanksgiving file closes."],"owner":"Pacific operations","due":"This week","jumpView":"map","jumpLabel":"View corridor"},"brazil":{"title":"Brazil","kicker":"Watch next · Revenue trending down","meta":"76 flights · $7.9M · −0.6% growth","why":"Brazil is the only large market going the wrong way. GRU timing and a soft São Paulo–Madrid cabin are doing most of the damage.","actions":["Review the GRU bank for missed connections into Madrid and Miami.","See whether São Paulo–Madrid can drop a frequency without stranding cargo.","Call the São Paulo station about currency and no-show rates before next week’s schedule lock."],"owner":"Latin America","due":"This week","jumpView":"countries","jumpLabel":"View countries"}}